1. People Keep Adopting Bitcoin at a Predictable Rate
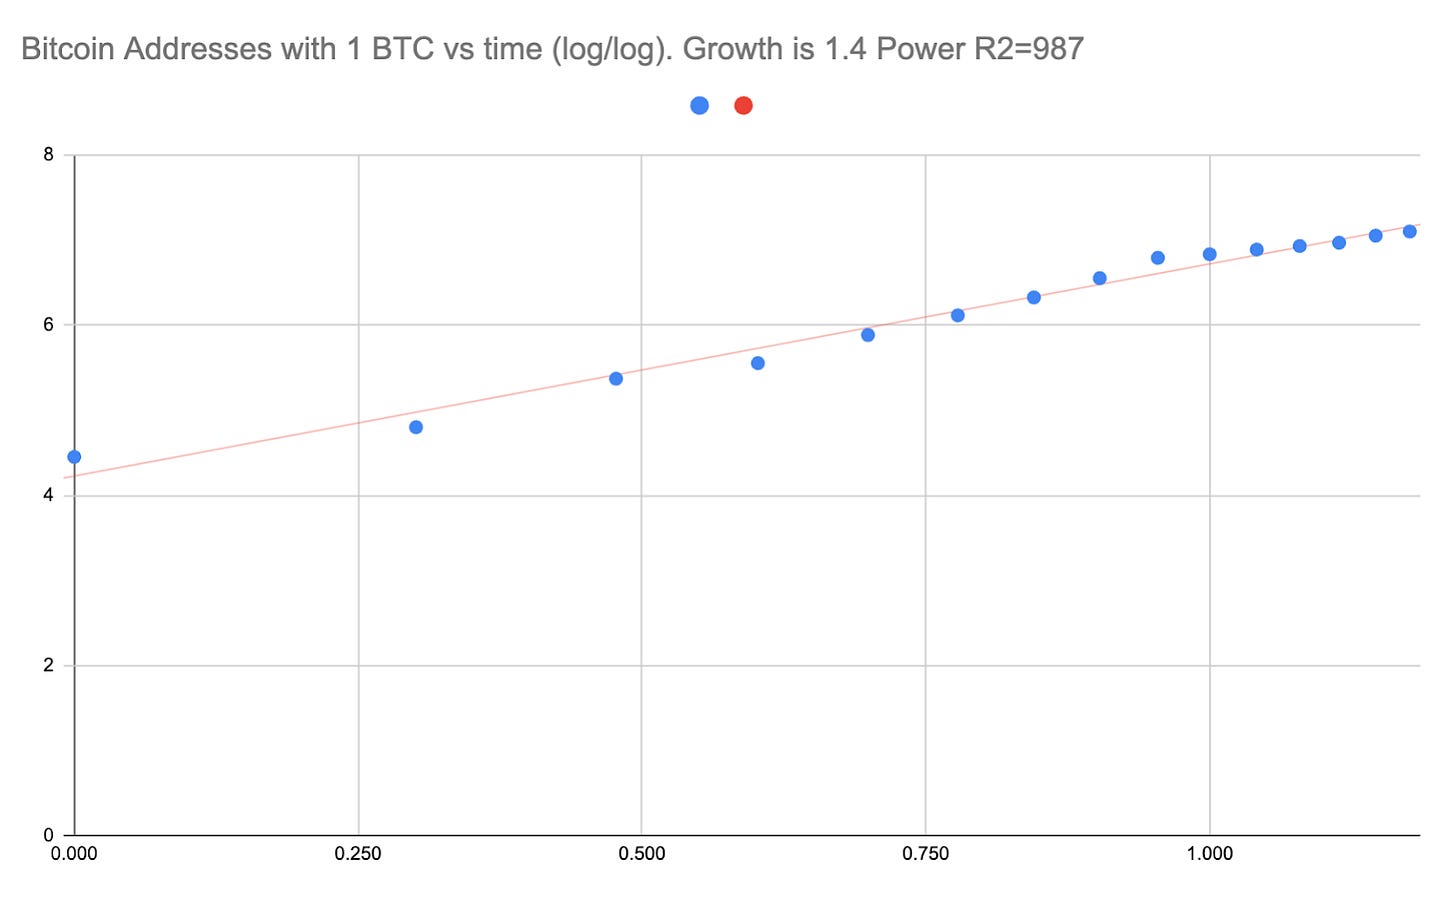
Here's something wild: the number of Bitcoin addresses with meaningful amounts grows like clockwork. We're talking 0.987 correlation - that's basically perfect in real-world data.
The insight most analysts miss is that this adoption rate is completely divorced from price action. During the 2022 bear market, when everyone was calling Bitcoin dead, adoption kept growing at the exact same mathematical rate. This tells you Bitcoin has fundamentally different demand drivers than traditional assets.
The power law varies by wealth cohort - around 3 for the $100+ crowd, 2 for the 0.1 BTC holders, 1.4 for whole coiners. What's fascinating is this creates natural wealth stratification that mirrors Pareto distributions in other networks. Bitcoin isn't just growing, it's developing the mathematical signature of mature monetary systems.
2. Halvings Used to Matter, Now They Don't
By 2013, half the Bitcoin supply was already out there. Today? We're at 94% mined with new supply under 1% per year. The halving was Satoshi's way to bootstrap the network, but we're way past that now.
Here's the key insight: Bitcoin has transitioned from a supply-driven to a demand-driven asset, but most models haven't caught up. Plan B's stock-to-flow worked during the supply-constrained phase but breaks down once network effects dominate. This transition happened around 2020, which explains why S2F predictions started failing.
Smart money understands this shift. The halvings still move prices because of narrative and positioning, but the fundamental driver has flipped to adoption velocity. That's why you see institutions accumulating regardless of halving timing.

3. Bitcoin Runs on Four-Year Cycles
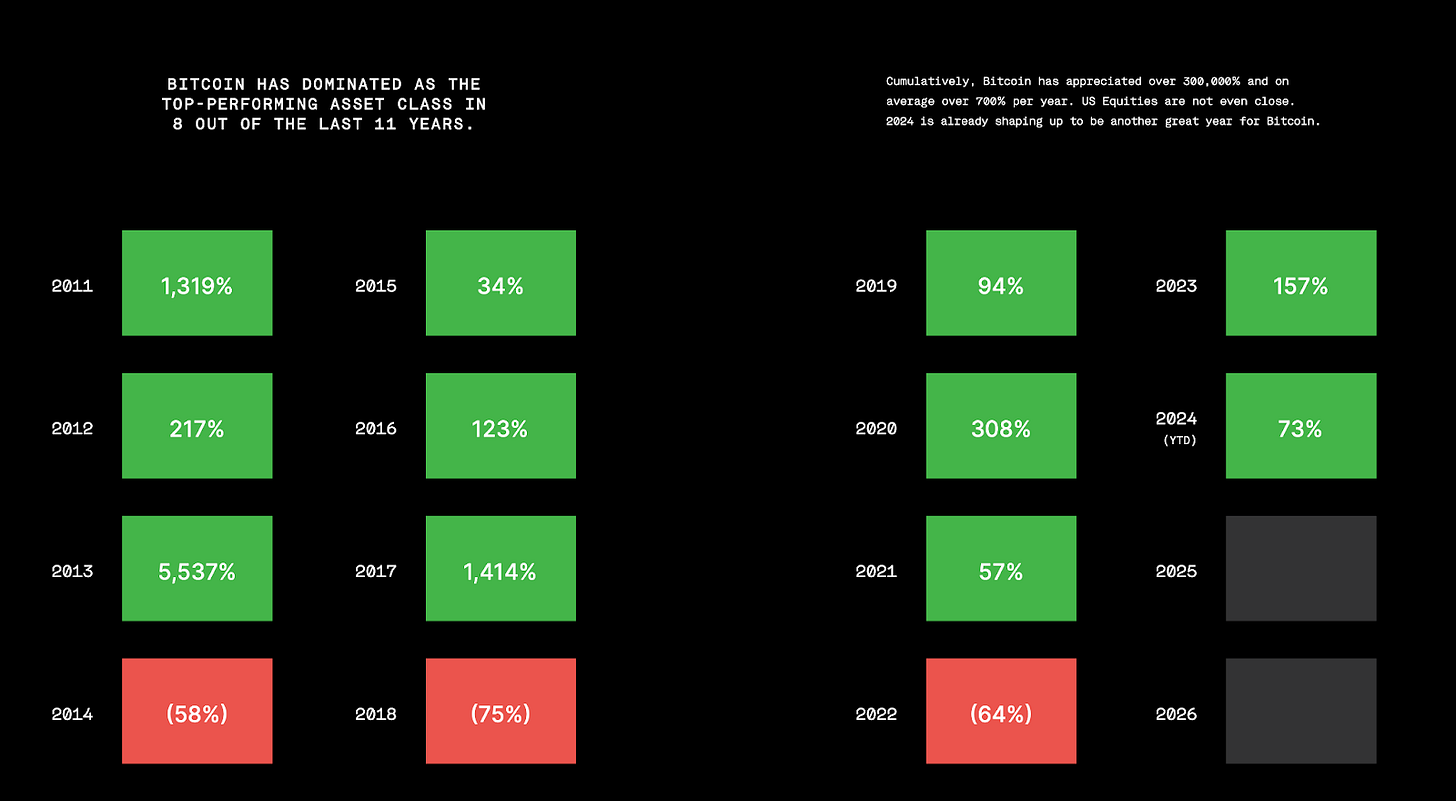
Three years up, one year down. That's been the pattern since the beginning. We're in year two right now (2024), which historically is when institutional capital starts rotating in before retail FOMO hits in year three.
This isn't about trader psychology - it's about global liquidity cycles intersecting with Bitcoin's adoption curve. The four-year pattern aligns suspiciously well with global credit cycles and institutional rebalancing periods. Bitcoin has become large enough that macro liquidity flows now drive its timing.
The smart play is recognizing where we are in the cycle and positioning accordingly. Most retail investors buy tops and sell bottoms because they're reacting to price, not understanding the underlying four-year flow of institutional capital.
4. Bitcoin Is for Big Transfers
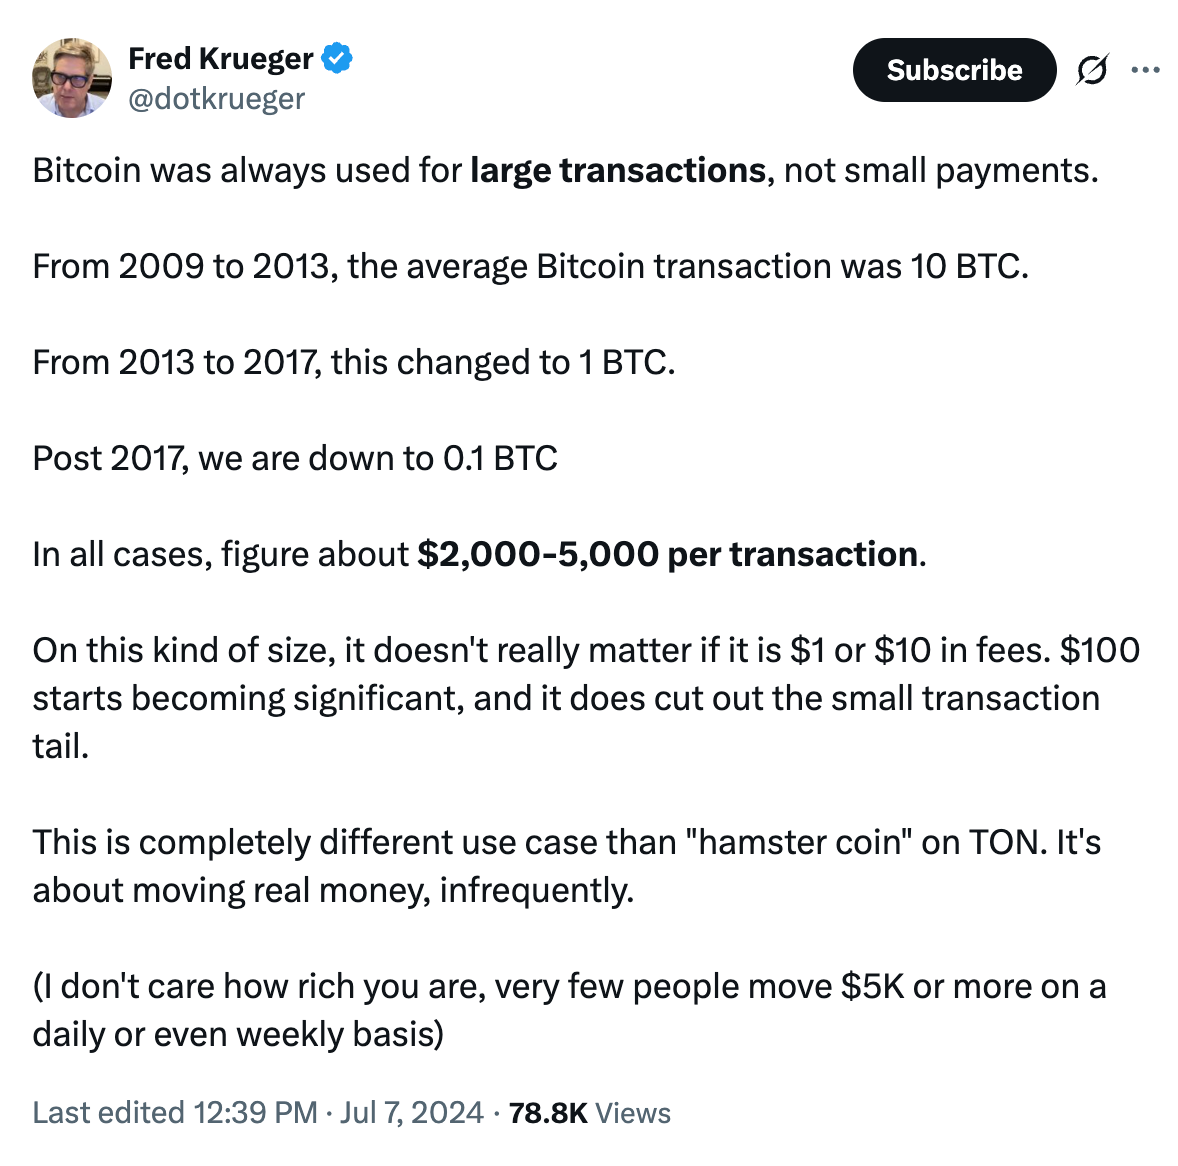
The average Bitcoin transaction is somewhere between $1,000 and $5,000. People don't use it to buy coffee - they use it like a wire transfer for serious money.
This reveals Bitcoin's actual competitive moat: it's not competing with Visa, it's competing with SWIFT. The $1-5k transaction size puts Bitcoin squarely in international wire territory, where it offers 24/7 settlement at a fraction of traditional costs.
The implications are huge. Bitcoin isn't a consumer payments play - it's capturing share of the $150 trillion annual wire transfer market. That's a completely different TAM than retail payments, and one where Bitcoin has genuine advantages over legacy infrastructure.
5. Price Growth Follows a Power Law
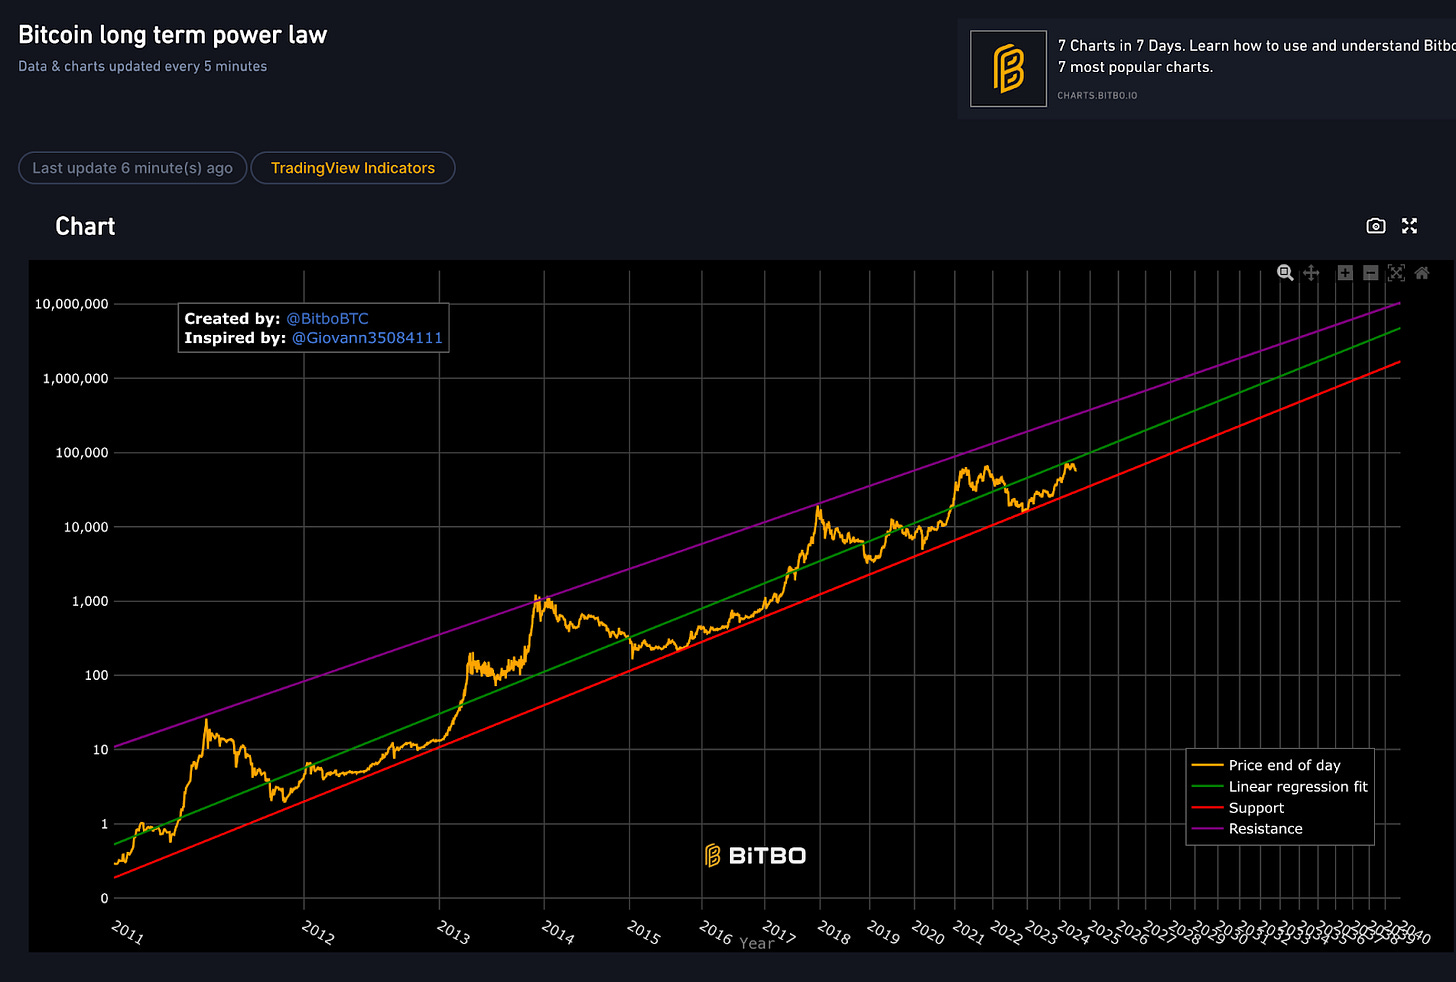
Supply is basically fixed. Adoption grows as the cube of time. So price grows as time to the 5.8 power, with about 0.25 volatility in log space.
This mathematical relationship is unprecedented in financial markets. Most assets follow random walks or mean reversion. Bitcoin follows network scaling laws, which means it has predictable long-term price targets that you can calculate.
The 5.8 power law implies Bitcoin price should reach roughly $1M by 2030-2032 if adoption continues at current rates. That's not hopium - it's what the math says. The question is whether global adoption can sustain cubic growth for another decade.
6. Bitcoin Falls Gently, Rises Violently
Bitcoin almost never drops more than one standard deviation below its trend line. But it regularly spikes two standard deviations above it (think 2017, 2020).
This asymmetric volatility profile is incredibly valuable for portfolio construction. Bitcoin provides convex returns - limited downside relative to trend with explosive upside potential. That's exactly what you want in a portfolio hedge against monetary debasement.
Traditional risk models completely miss this. They assume normal distributions when Bitcoin clearly exhibits positive skew. Smart allocators are building positions sized for the asymmetric payoff structure, not the symmetric risk models that compliance departments use.
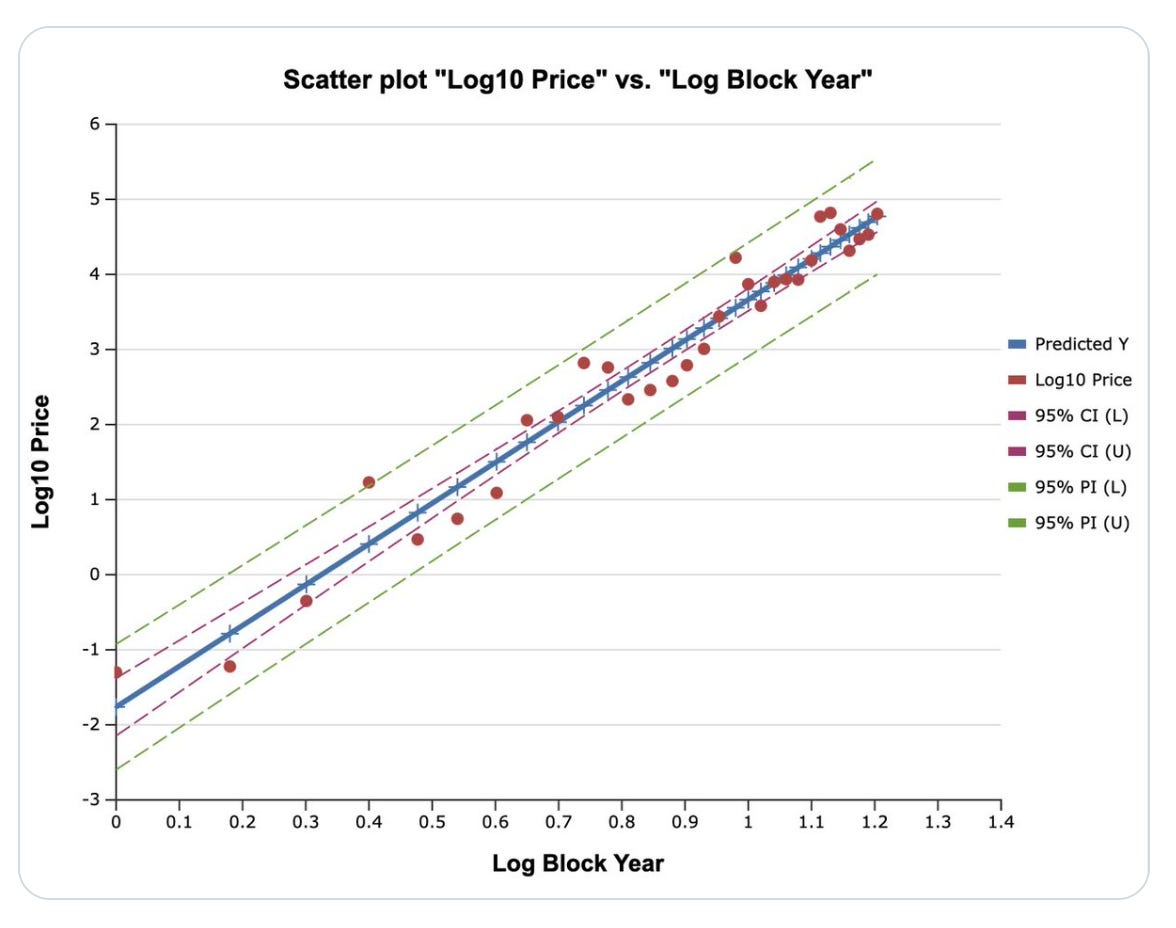
7. Power Laws and S-Curves Are the Same Thing Here
Stephen Perrenod figured out something important: whether Bitcoin is following a power law or an S-curve doesn't actually matter because in the early stages, they look identical mathematically.
The crucial insight is that Bitcoin isn't in exponential bubble territory - it's following sustainable network growth patterns. This distinction matters enormously for valuation. Exponential growth always breaks. Power law and S-curve growth can persist for decades.
This mathematical foundation gives Bitcoin something most assets lack: a theoretical framework for long-term valuation that's based on network physics rather than sentiment or relative comparisons.
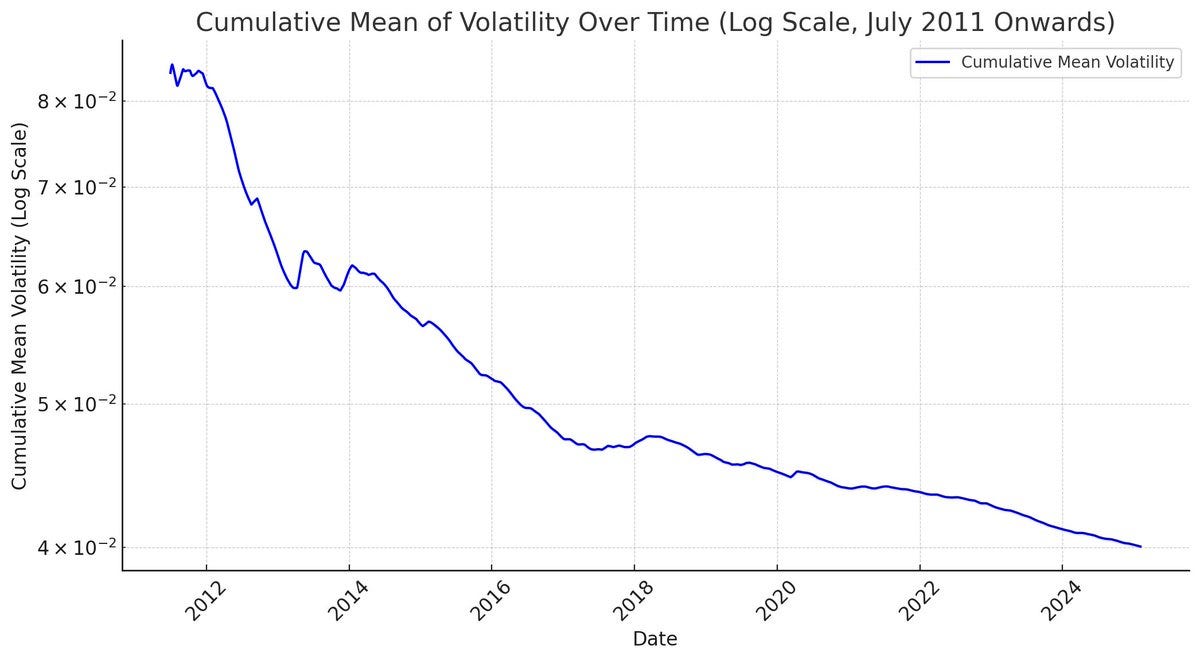
8. Volatility Keeps Going Down
Since 2011, Bitcoin's volatility has been steadily declining. This is exactly what you'd expect as the network matures and more people use it.
But here's what most people miss: declining volatility makes Bitcoin increasingly attractive for institutional allocation. We're approaching the point where Bitcoin's risk-adjusted returns will be comparable to other alternative assets that institutions already hold.
The volatility compression also suggests Bitcoin is transitioning from a speculative growth asset to a maturing store of value. That's a fundamental regime change that most market participants haven't priced in yet.
The Bottom Line
These aren't predictions or theories. They're patterns that have held for over a decade across every possible market condition. Bitcoin behaves like a growing network governed by mathematical laws, not like a speculative asset driven by sentiment.
The strategic implication is clear: Bitcoin is transitioning from a speculative technology to monetary infrastructure. The mathematical relationships suggest we're still in the early adoption phase of this transition, with predictable growth patterns that most traditional analysis completely misses.
Understanding this changes everything about how you think about Bitcoin allocation, timing, and long-term targets. The data tells a very clear story if you know how to read it.